Investors Financial Information
Numbers in Focus and Review
| Financial Year | Quarterly Summary | Quarterly Results | |||
|---|---|---|---|---|---|
| Q1 | Q2 | Q3 | Q4 | ||
| 2026 | |||||
| 2025 | |||||
| 2024 | |||||
| 2023 | |||||
| 2022 | |||||
| 2021 | |||||
| 2020 | |||||
| (in RM million) | FY2025 | FY2024 | FY2023 | FY2022 | FY2021 |
|---|---|---|---|---|---|
| Revenue | 11,334.7 | 9,603.6 | 11,583.8 | 15,578.7 | 11,251.7 |
| Profit before Interest and Tax (PBIT) | 1,700.6 | 1,535.3 | 1,815.5 | 2,494.2 | 1,747.5 |
| Shareholders' Equity | 12,294.0 | 11,678.6 | 11,330.8 | 10,943.7 | 10,005.4 |
Our Revenue, PBIT and
Shareholders' Equity
Revenue
Profit before Interest and Tax (PBIT)
Shareholders' Equity
FFB, CPO and Palm Kernel Production Over The Months
CPO (MT)
Palm Kernel (MT)
FFB (MT)
Oil & FFB Yields
Oil Yields
FFB Yield Per Mature Hectare
Crop Statement of Oil Palm
| FY2025 | FY2024 | FY2023 | FY2022 | FY2021 | |
|---|---|---|---|---|---|
| Average mature area harvested (hectare) | 138,597 | 144,959 | 143,996 | 141,011 | 140,418 |
| FFB production (metric tonnes) | 2,839,583 | 2,803,965 | 2,686,356 | 2,726,516 | 2,917,621 |
| FFB yield per mature hectare (metric tonnes/hectare) | 20.49 | 19.34 | 18.66 | 19.34 | 20.78 |
| Mill production (metric tonnes) | |||||
| Crude palm oil | 616,307 | 625,127 | 580,688 | 607,200 | 646,692 |
| Palm kernel | 106,914 | 112,059 | 114,818 | 124,114 | 135,853 |
| Oil extraction rate (%) | |||||
| Crude palm oil | 21.33 | 21.77 | 20.92 | 21.39 | 21.39 |
| Palm kernel | 3.70 | 3.90 | 4.14 | 4.37 | 4.49 |
| Average selling price (RM/metric tonnes) | |||||
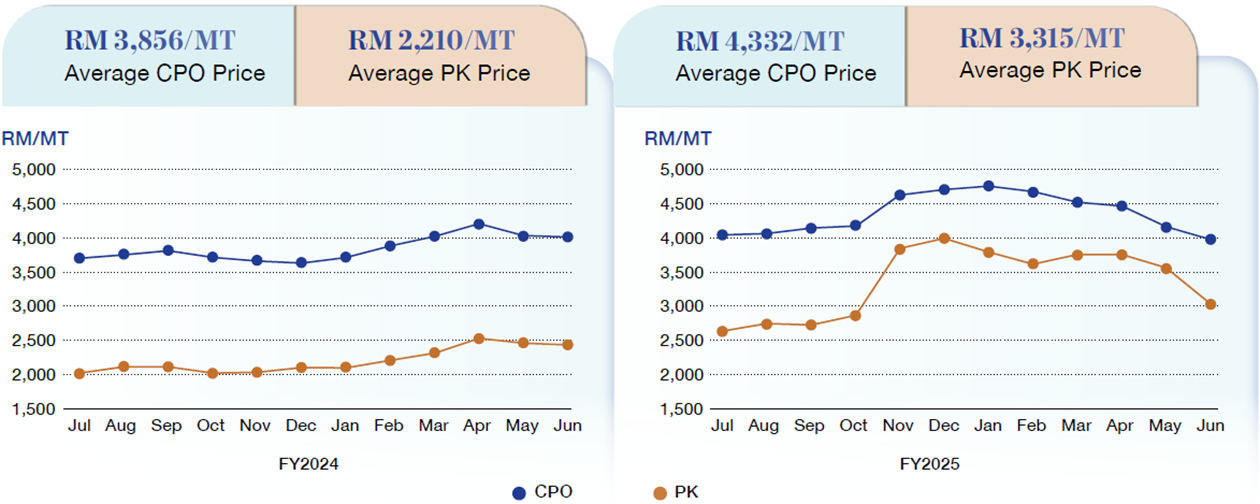
| Crude palm oil | 4,332 | 3,856 | 4,118 | 4,688 | 3,076 |
| Palm kernel | 3,315 | 2,210 | 2,233 | 3,593 | 2,115 |
Area Statement
| FY2025 | FY2024 | FY2023 | FY2022 | FY2021 | |
|---|---|---|---|---|---|
| OIL PALM | |||||
| Mature | 135,423 | 147,152 | 146,069 | 143,787 | 143,749 |
| Immature | 32,460 | 24,955 | 27,749 | 31,405 | 33,177 |
| Subtotal | 167,883 | 172,107 | 173,818 | 175,192 | 176,926 |
| COCONUT | |||||
| Mature | 494 | 249 | 249 | 54 | 54 |
| Immature | 3,122 | 2,882 | 1,921 | 909 | 236 |
| Subtotal | 3,616 | 3,131 | 2,170 | 963 | 290 |
| Others | 960 | 964 | 937 | 825 | 889 |
| Total planted area | 172,459 | 176,202 | 176,925 | 176,980 | 178,105 |
| Nursery | 334 | 338 | 358 | 324 | 254 |
| Estate under development | 381 | 378 | 462 | 532 | 554 |
| Building sites, labour lines, roads and others | 32,528 | 28,155 | 29,384 | 29,277 | 28,074 |
Plantation Statistics
Crop Mix
Crop Mix
172,459 Ha
Total Planted Area
97%
2%
1%
As of 30 June 2025
Oil Palm
Coconut
Others
*Other crops are negligible.
Oil Palm Hectarage by Age
Group
167,883 Ha
Total Oil Palm Planted Area
21%
45%
15%
19%
Malaysia
146,506 Ha
Total Oil Palm Planted Area
24%
39%
16%
21%
Indonesia
21,377 Ha
Total Oil Palm Planted Area
83%
8%
9%
As of 30 June 2025
Past Prime
Prime
Young
Immature
Oil Palm Hectarage by Region
East Malaysia
64%
107,055 Ha
Total Oil Palm Area
75%
79,795 Ha
25%
27,260 Ha
Peninsular Malaysia
23%
39,451 Ha
Total Oil Palm Area
91%
36,078 Ha
9%
3,373 Ha
Indonesia
13%
21,377 Ha
Total Oil Palm Area
91%
19,550 Ha
9%
1,827 Ha
As of 30 June 2025
Mature
Immature
Average Realised CPO and PK Prices
| In RM million unless otherwise stated | 2025 | 2024 | 2023 | 2022 | 2021 |
|---|---|---|---|---|---|
| RESULTS | |||||
| Revenue | 11,334.7 | 9,603.60 | 11,583.80 | 15,578.70 | 11,251.70 |
| Profit before interest and tax | 1,700.6 | 1,535.30 | 1,815.50 | 2,494.20 | 1,747.50 |
| Net foreign currency translation gain/(loss) on foreign currency denominated borrowings and deposits | 284.1 | (18.9) | (174.5) | (12.8) | 118.5 |
| Net interest expenses | (107.2) | (117.9) | (115.0) | (128.8) | (126.2) |
| Profit before tax | 1,877.5 | 1,398.5 | 1,526.0 | 2,352.6 | 1,739.8 |
| Tax expense | (341.1) | (282.2) | (396.0) | (583.7) | (323.5) |
| Profit for the financial year | 1,536.4 | 1,116.3 | 1,130.0 | 1,768.9 | 1,416.3 |
| Attributable to: | |||||
| Owners of the parent | 1,520.6 | 1,109.4 | 1,114.2 | 1,725.3 | 1,394.3 |
| Non-controlling interests | 15.8 | 6.9 | 15.8 | 43.6 | 22.0 |
| ASSETS | |||||
| Property, plant and equipment | 9,432.6 | 9,229.1 | 8,995.2 | 8,709.2 | 8,608.7 |
| Investments in associates | 3,245.8 | 3,103.3 | 3,013.3 | 3,110.0 | 3,144.5 |
| Other non-current assets | 661.9 | 625.2 | 647.1 | 669.2 | 564.7 |
| 13,340.3 | 12,957.6 | 12,655.6 | 12,488.4 | 12,317.9 | |
| Current assets | 4,763.2 | 4,984.6 | 4,926.3 | 6,679.4 | 5,337.8 |
| Assets classified as held for sale | 27.2 | - | - | - | - |
| 18,130.7 | 17,942.2 | 17,581.9 | 19,167.8 | 17,655.7 | |
| EQUITY AND LIABILITIES | |||||
| Total Shareholders’ Equity | 12,294.0 | 11,678.6 | 11,330.8 | 10,943.7 | 10,005.4 |
| Non-controlling interests | 338.8 | 331.1 | 339.8 | 340.8 | 309.0 |
| Total equity | 12,632.8 | 12,009.7 | 11,670.6 | 11,284.5 | 10,314.4 |
| Non-current liabilities | 3,847.3 | 4,351.7 | 4,235.8 | 4,131.7 | 2,303.7 |
| Current liabilities | 1,647.2 | 1,580.8 | 1,675.5 | 3,751.6 | 5,037.6 |
| Liabilities classified as held for sale | 3.4 | - | - | - | - |
| Total liabilities | 5,497.9 | 5,932.5 | 5,911.3 | 7,883.3 | 7,341.3 |
| 18,130.7 | 17,942.2 | 17,581.9 | 19,167.8 | 17,655.7 | |
| Net operating profit after tax (‘NOPAT’) | 1,642.6 | 1,238.0 | 1,243.5 | 1,889.9 | 1,541.6 |
| Average shareholders’ equity | 11,986.3 | 11,504.7 | 11,137.3 | 10,474.5 | 9,650.8 |
| Average capital employed1 | 17,153.1 | 16,927.7 | 17,178.3 | 17,062.6 | 16,178.7 |
| FINANCIAL STATISTICS | |||||
| Basic earnings per share (sen) | 24.51 | 17.88 | 17.95 | 27.74 | 22.26 |
| Dividend per share (sen) | 10.5 | 9.5 | 11.0 | 14.0 | 10.5 |
| Net assets per share (sen) | 198 | 188 | 183 | 176 | 160 |
| Return on average shareholders’ equity (%) | 12.69 | 9.64 | 10.00 | 16.47 | 14.45 |
| Return on average capital employed (%) | 9.58 | 7.31 | 7.24 | 11.08 | 9.53 |
| Net debt/Equity(%)2 | 13.69 | 13.55 | 13.99 | 22.80 | 29.37 |
| SHARE PERFORMANCE | |||||
| Market share price (RM): | |||||
| – Highest | 4.08 | 4.22 | 4.27 | 4.76 | 4.64 |
| – Lowest | 3.42 | 3.69 | 3.59 | 3.49 | 3.65 |
| – Closing | 3.74 | 3.70 | 3.73 | 3.84 | 3.76 |
| Shares trading volume (million) | 494 | 557 | 616 | 884 | 524 |
| Market capitalisation | 23,201.8 | 22,953.7 | 23,139.8 | 23,857.8 | 23,495.4 |
Notes:
1 Average capital employed comprises shareholders’ equity, non-controlling interests, long term liabilities, borrowings, lease liabilities and deferred tax.
2 Net debt represents total borrowings and lease liabilities less short term funds, deposits with financial institutions and cash and bank balances.
Contact Us
Mr Amir Mohd Hafiz bin Amir Khalid
Investor Relations
Level 28, IOI City Tower 2, Lebuh IRC,
IOI Resort City,
62502 Putrajaya, Malaysia.
| Tel: | (603) 8947 8888 |